
Sahil Nijhawan PhD, writes about the novel methods of counting animals devised to assist his study of tigers in the remote area of north eastern India.
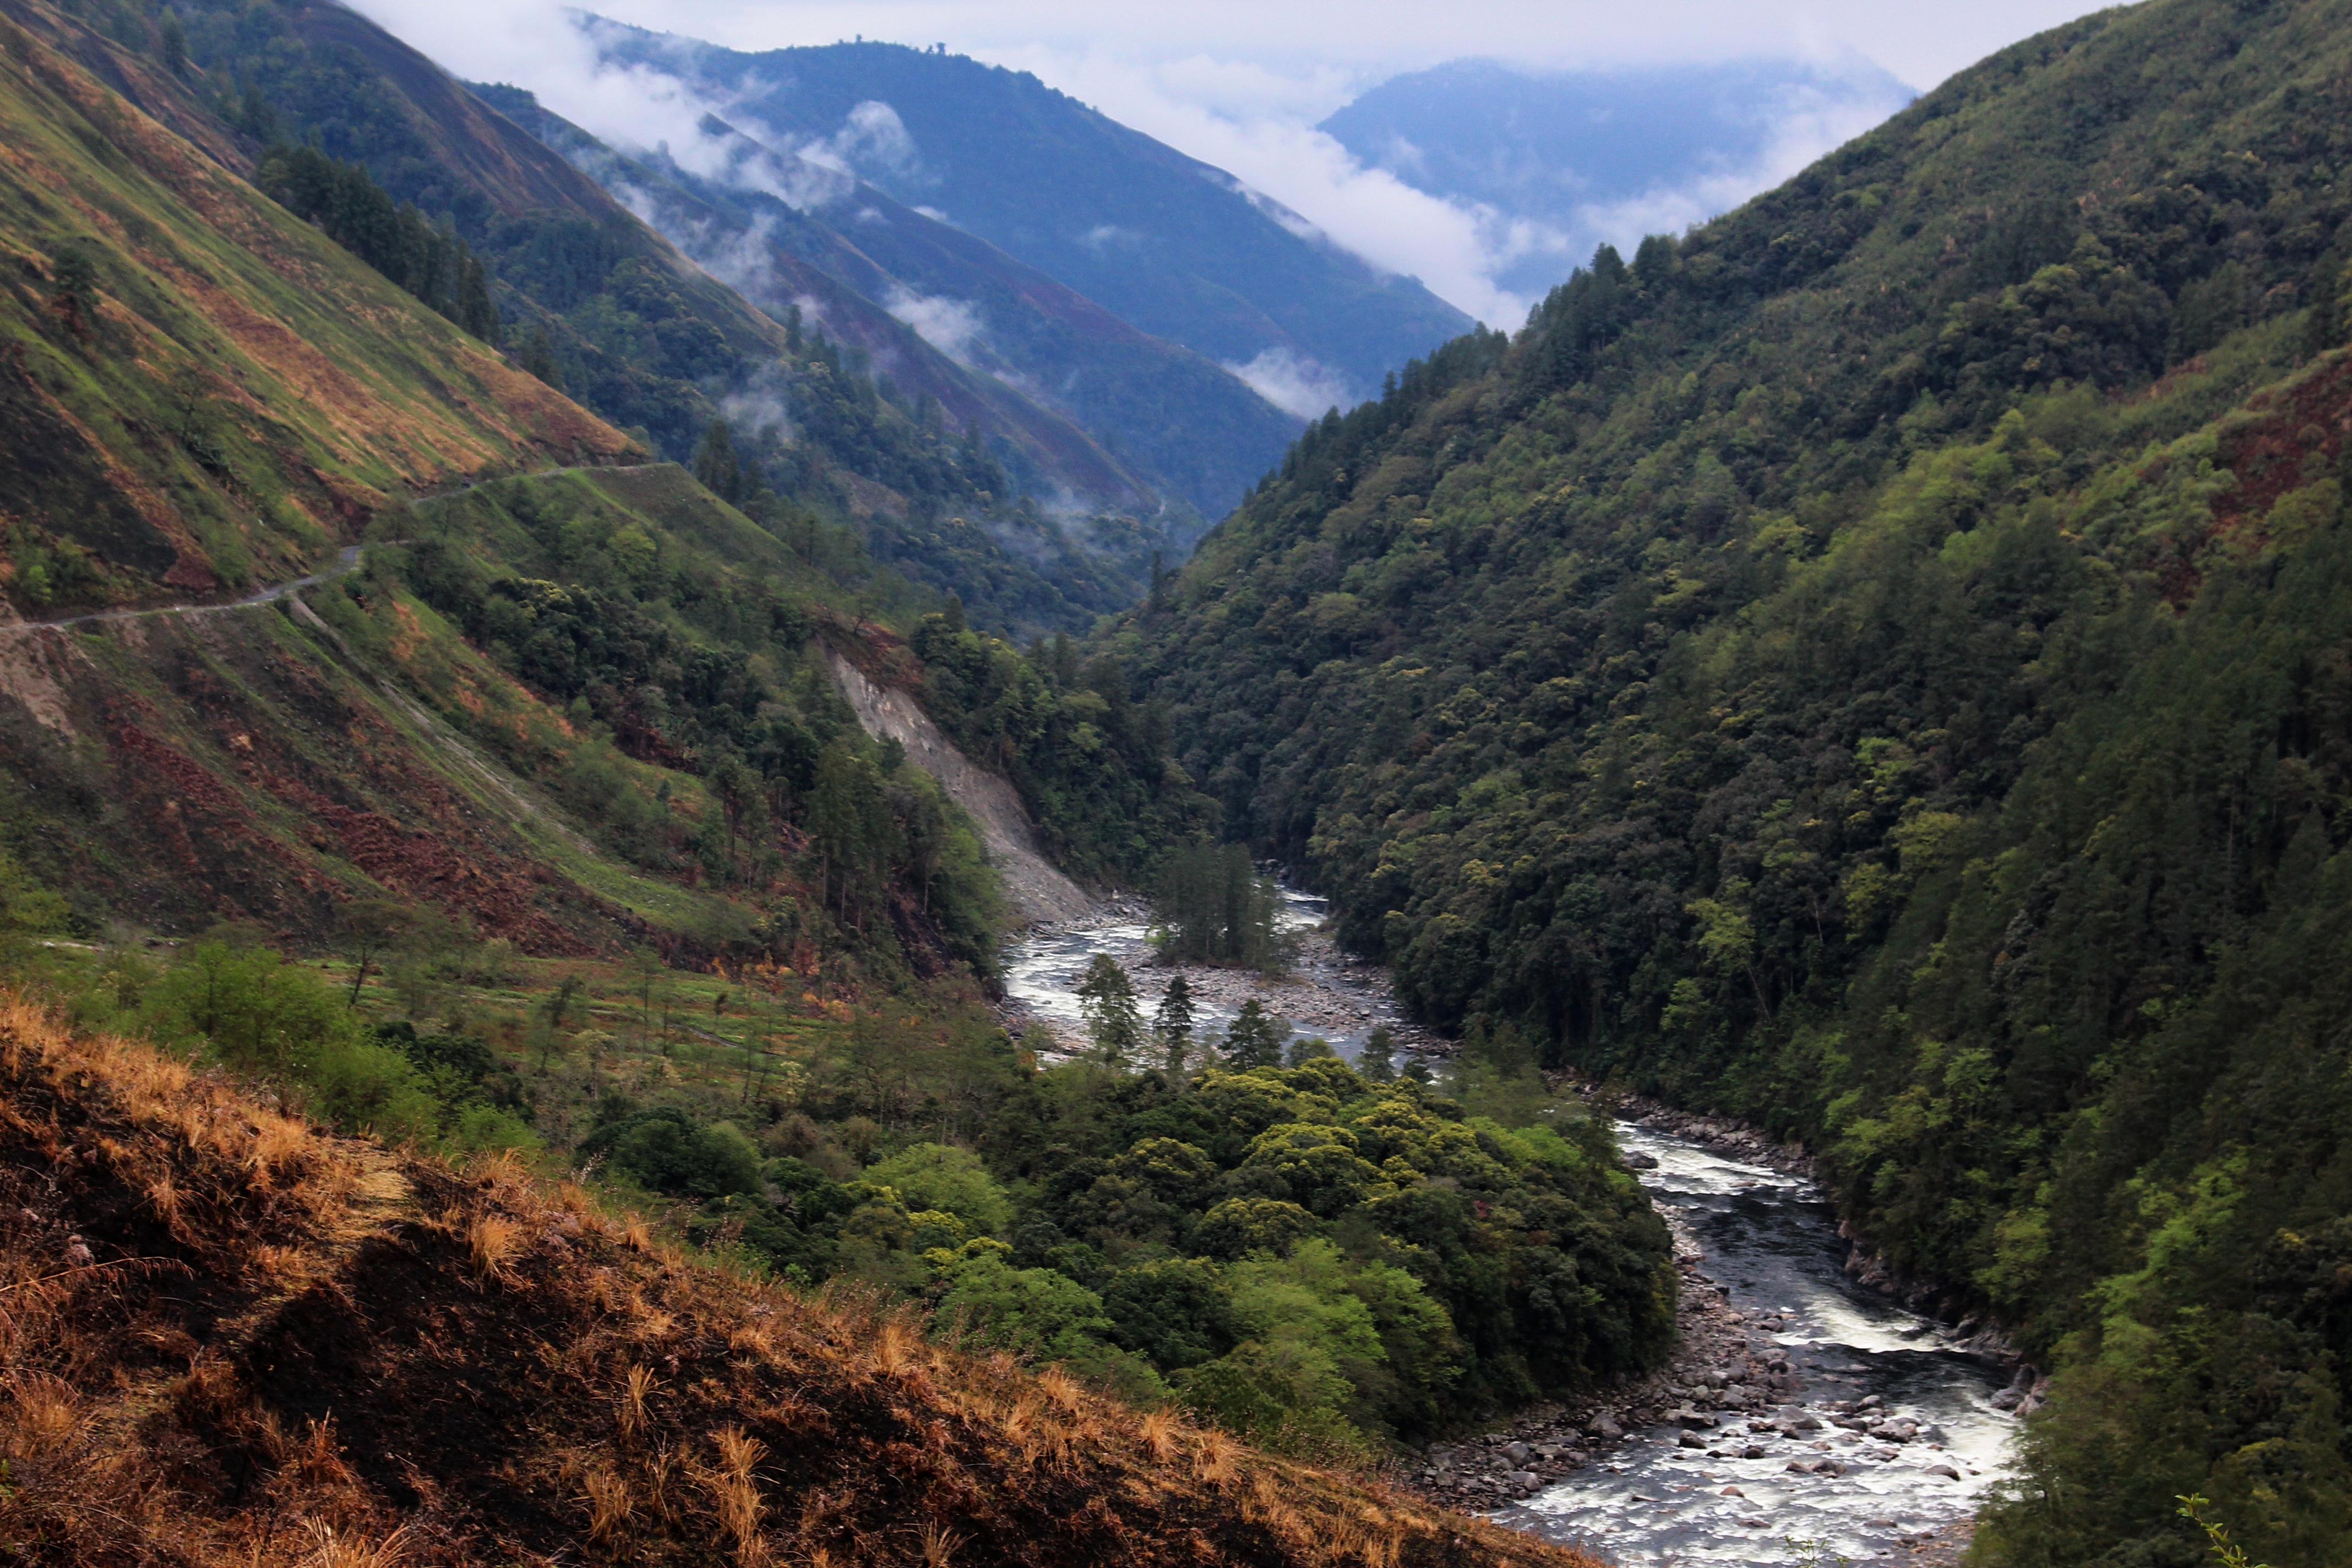
Arunachal Pradesh, India
In the broadest sense, my doctoral research is an investigation into the role of local culture and belief systems in protecting endangered animals; in particular, those that have a high market value. I conducted long-term fieldwork in north eastern India with an indigenous community called the Idu Mishmi (or Idu hereafter). The Idu live in the Eastern Himalayas and the Idu homeland, Dibang Valley, abounds in lush forested mountains. A large majority of these forests do not come under any legal protection. I was interested in understanding how Idu cultural practices impacted wildlife conservation, in particular, that of the endangered tiger, and whether Idu culture had led to the protection of tigers in the area. To thrive, tigers require – a) protection from direct persecution; b) abundant large prey; and c) sufficient habitat. Therefore, to study the impact of Idu culture on tigers, I also had to understand its impact on tiger prey and tiger habitat (forest). In order to understand whether certain actions are having either a positive or negative impact on animals, we need to begin by determining how many animals there are in an area, i.e. count animals. If animals in the unprotected Idu forests are just as abundant as in the protected forests (national parks or tiger reserves), then perhaps Idu culture has a role to play in their protection. However, counting animals in dense forests in rugged mountainous terrain is notoriously difficult as they are nearly impossible to sight. In this post, I will talk about a novel method that we developed to count animals without the need to directly see them.
Counting animals
“How many animals in an area?” is a key question both in ecology and conservation. We need to able to measure the size of animal population in an area, with an acceptable level of precision, and monitor changes in it overtime to understand whether conservation interventions (increasing park guards, enhancement of the habitat etc.) are having the intended effect. Now, it is exceedingly hard to count every single individual animal (especially when they all look the same) in an area the size of a typical national park (approx. 1000 km2). We therefore count animals in a smaller area and then carefully extend/extrapolate the results to the rest of the site. Historically, we have only been able to count animals that we could easily see. In the vast open African savannahs with some of the largest animal assemblages of large animals on the planet – aerial surveys were done from low flying airplanes to count elephants, giraffes, rhinos and large antelope. In more wooded areas where animals are harder to see from the sky, scientists and wildlife managers have used a method called Distance Sampling. Teams of 2-4 people walk in straight lines etched across the area of interest looking for animal sightings. All sightings along with the distances of sighted animals from the observers are recorded. Using mathematical equations, animal density – no of animals per unit area (generally squared kilometers) – is calculated.
Distance Sampling works wonderfully in open forests and on larger animals that can be visually detected. But, what if the animals were too small, shy or rare to be seen easily? Or, in tropical forests with dense understory where visibility is greatly reduced? Or, if animals alter their behaviors, in response to hunting, to avoid being seen? Furthermore, to produce accurate results, distance sampling requires a substantial amount of sightings. For rarer, smaller, shy and hunted species in very dense forests or mountainous rugged terrain conditions for distance sampling are difficult to meet. It is due to a lack of alternative methods, population estimates of many rare, elusive and endangered species in challenging habitats do not exist. This greatly curtails our understanding of their conservation status amidst increasing threats.
Cameras as our eyes in the forest
In late 90s, automatic cameras that could be placed in the forest to take pictures of animals revolutionized the field of animal monitoring. These are stealth cameras that are triggered (either by detecting motion or infrared heat) by a passing animal resulting in a photographic ‘capture’ of the animal. Camera traps have become our ‘eyes’ in the forest that can monitor 24 x 7 the movement and presence of even the rarest of animals. They have dramatically reduced the effort spent in the field while increasing the quantity and quality of information collected. All a scientist has to do is deploy them out in the field, collect them a few weeks/months later and download the images to see the ‘sightings’ without ever having disturbed the animals. Camera trap technology has seen major advances in recent years. Some camera models can record HD video and transmit images, in real time, via a satellite link to a receiver based in an office.
Camera traps have proved very effective in estimating populations of endangered carnivores, such as tigers, jaguars and leopards where individuals have uniquely identifiable markings. By carefully studying photographs amassed by camera traps and identifying individuals, one can count the number of animals that live in the area surveyed by camera traps. However, most animals do not have unique patterns. Many species of deer, wild pigs, antelope and wild bovines (bison) all look the same. They also travel in large herds which makes it is very difficult to tell individuals apart. How do we use camera trapped images to estimate population sizes of these species? To solve this issue, Dr. Marcus Rowcliffe and his team at ZSL’s Institute of Zoology (IoZ) developed a cool new method based on gas theory in Physics.
Animals as gas particles
Physicists have been interested in estimating the density of gas particles/molecules in the air and to do that, they proposed a method which they called the Gas Theory. According to gas theory, to find out the number of gas particles (all particles look the same) in an enclosed space, let’s say a box, we first need to place a stationary object inside the box and count the number of collisions between gas particles and the stationary object. Then, we need to know the speed at which the particles move (the higher the speed, the higher likelihood of a particle coming into contact with the stationary object). Finally, we need to put these two into an equation that gives us the estimate of the number of particles per unit space (i.e. density).
Dr. Rowcliffe (and colleagues) took this theory and applied to animals in a forest. They called it the Random Encounter Model (REM). Now the animals became gas particles moving about the forest and camera traps were the stationary objects. Every time an animal comes into contact with a camera trap, a ‘collision’ occurs and the camera trap takes a picture of the animal. So the number of collisions is simply the number of photographs of a species. But, there are two important inputs that go into the equation that need to be factored in. First, gas theory assumes that the zone of contact is 360 degrees (the stationary object is assumed to be a ball-like object) and that all molecules are of the same size. A camera trap on the other hand does not have a 360 field of view, the field of view is much smaller, and the field of view changes with the size of the animal. Since most camera are triggered by detecting heat (infrared) larger animals that produce more heat can be more easily triggered and at larger distances away from the camera than smaller animals. Therefore, the field of view (the area available for a ‘collision’/’capture’ to occur) is different for different species. And remember that the equation also requires animal speed, i.e. faster moving species will cover larger distances and are therefore more likely to be captured by more cameras than slower species that move less. The question now is – how do we measure the speed and size of camera detection zone for different animal species?
How fast do they walk?
Typically, scientists put radio collars on animals that send information about its location (GPS fixes) at regular time intervals which is used to calculate speed or daily movement (distance moved in a day). However, this process, in addition to being expensive (cost of the radio collar, tracking devices etc.) is highly invasive. Additionally, getting permits to capture animals are increasingly difficult to procure and require a huge amount of logistics. We developed a new method to derive animal speeds from camera trap images.
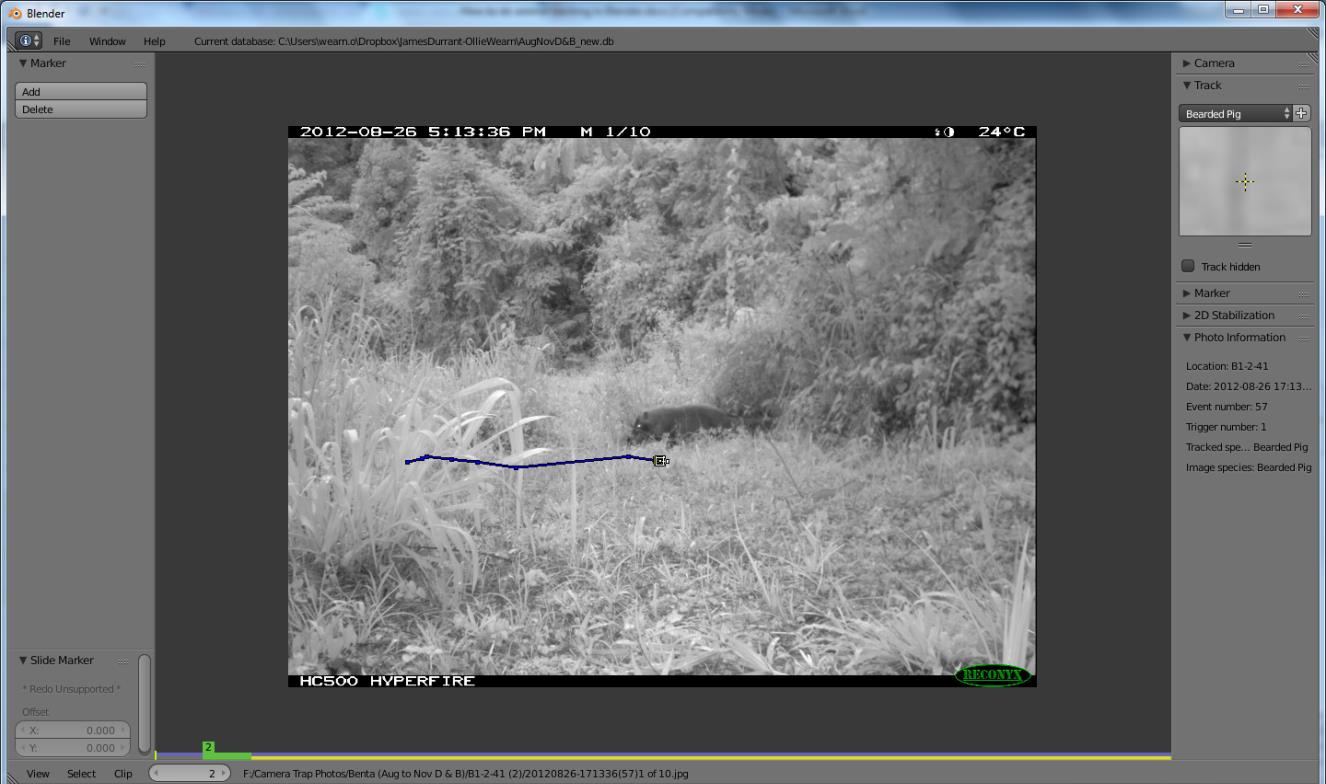
Figure 1: Tracking animals in Blender. The tracked path is shown in navy blue.
We programmed our camera traps to take a rapid-fire sequence of 10 images every time it was triggered by a passing animal resulting in a near video sequence. In this sequence of images, we can see how an animal moves across the space in front of the camera.We then developed visual software, called Blender, where we could put markers on animals in images. The markers record the pixel position of an animal in an image. The marker can be moved as the animal moves through the sequence of images to create a ‘path’ that follows an animal’s movement across the sequence of images (see Figure 1). In effect, you can ‘track’ animals. We can measure the length of this path, or the distance (in image pixel units, called image distance) that the animal has moved from image 1 to last image (image 10, 20, 30 or as many images recorded of an animal). Camera traps record the time at each capture, so we can calculate movement time, that is the time between the first and the last image. Now, speed equals distance over time. The speed of an animal is image distance over movement time. Similarly, we could also find the distance (in pixels) at which the animals of different species first triggered cameras to get a sense of the size of the zone within which different species were being detected.
The process of ‘tracking’ animals in the images, as fun as it may sound, wasn’t easy. Markers had to be added to each image bearing in mind that they were placed on the same part of the animal’s body across the entire sequence of images. Over two years of fieldwork, I had placed nearly 300 cameras that had captured more than 150,000 images. To process such a gigantic image repository, I needed more than a set of hands. Thanks to an exceptionally competent team of 4 interns, who worked tirelessly in a windowless room at the IoZ’s offices in the London Zoo through the blistering summer of 2016, (and a grant from 21st Century Tiger) we were able to track thousands of animal paths.
Pole dancing
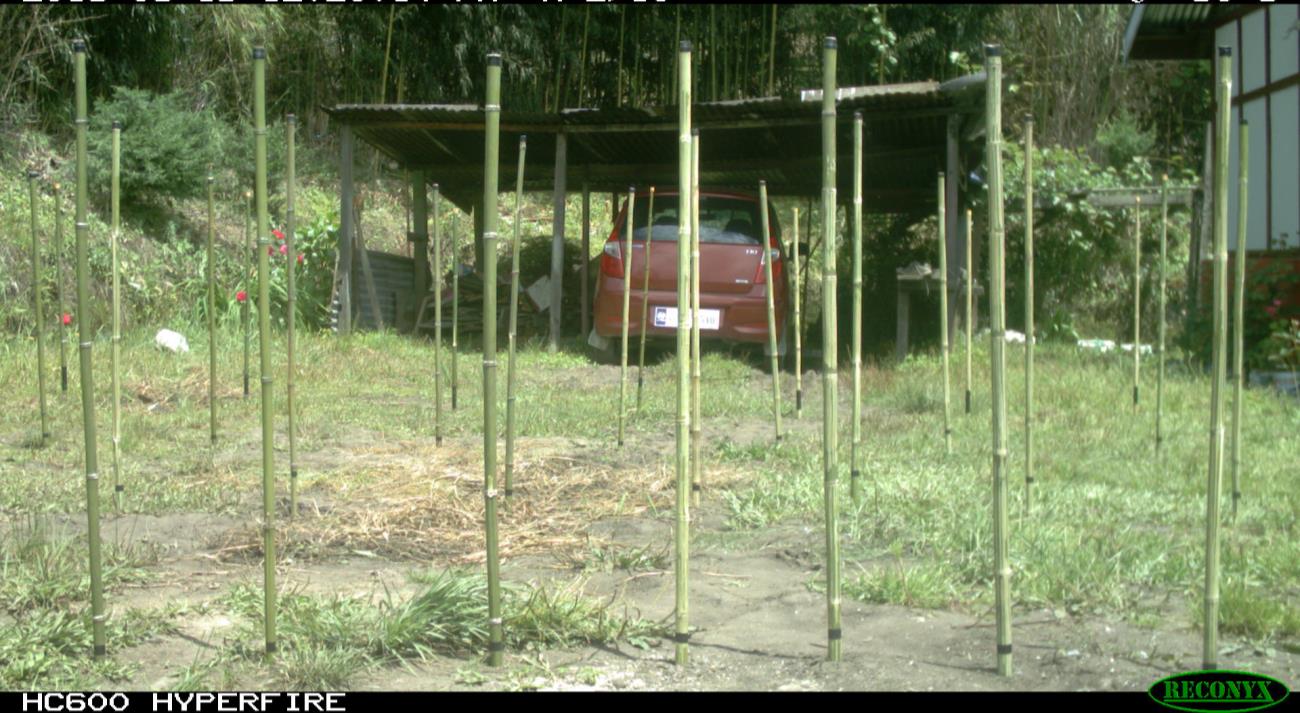
Figure 2: The first step with pole setup
The next challenge was to convert images distances (and image speeds) into real ground distances. To do this, we developed a novel two-step process that was executed in the field. In the first step, before cameras were placed in the field, we arranged a number of meter long poles at known distances (3, 5, 7, 9 meters) from a fixed location where a camera trap was mounted (Figure 2). A flat and open area for chosen for this purpose. In the camera trap picture of this set up, we measured the number of pixels that corresponded to known ground distances (3, 5, 7 and 9 meters) in order to develop a relationship between ground lengths and number of pixels. This is the relationship between a camera’s resolution (depends on the type of lens used) and ground distances and should be the same for all camera traps from a given manufacturer.
The second step was a process we called ‘pole dancing’. When cameras are placed in the field, especially in mountainous areas, the ground surface is typically not flat so the relationship between pixels and ground distance is likely to change. We have to adjust this relationship based on the type of ground surface. When a camera was placed in the field, we took pictures of a one meter pole (divided into 10 black and white stripes) at varying distances from the camera trap (Figure 2, dancing around with a pole J).
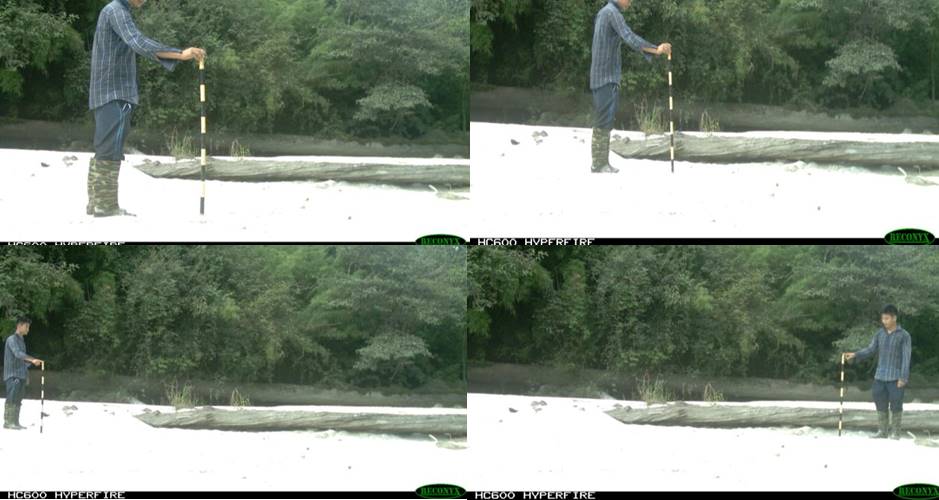
Figure 3: My field assistant doing ‘pole dancing’ in the field.
In Blender, we placed markers where the poles landed on the ground. We used the relationship developed in the first step to predict the ground locations of the stripped pole. The predicted locations were entered in a computer algorithm to ‘recreate’ the surface in front of each camera trap. Through this process, for each camera location in the field, we were able to artificially recreate ground surface and map the distance of every single pixel from the camera trap. These recreated surfaces were then used to convert image distances of animals tracked in Blender into ground distances. These ground locations of animals were then used to calculate ground speeds and the size of the detection zone for each species at each camera location. This is how we tracked animals without ever having seen or caught one in life real. Finally, the number of photographic captures, ground speeds and the size of the detection zone were all plugged into the equation derived from gas theory to estimate the population size of each animal species in Idu Mishmi forests. For some of the animal species, such as the Mishmi takin, Asiatic golden cat and Gongshon muntjac, these were the first ever population!
I compared the animal populations in Idu forests estimated using gas theory with those from national parks in the region that are heavily protected and guarded by national/regional governments and conservation organizations. If Idu forests had significantly fewer animals than other protected sites, it would indicate formal protection was necessary to protect animals and that, perhaps, Idu practices did not have a positive impact on wildlife protection. I found that animals were just as abundant in Idu areas as in other protected sites. This is a significant finding because it shows that informal/cultural means of protection in certain areas can deliver conservation outcomes that are just as good as or better than formal means of protection.
The findings of my research have two important implications for conservation. Firstly, we have demonstrated a reliable method to non-invasively study rare and elusive wildlife in challenging field conditions. This allows for animal populations to be reliably monitored which is indispensable for effective conservation planning. Secondly, and on a broader level, it urges us to think about how we devise conservation policy for highly endangered species and whether, and in which capacity, we decide to include local people has partners.